
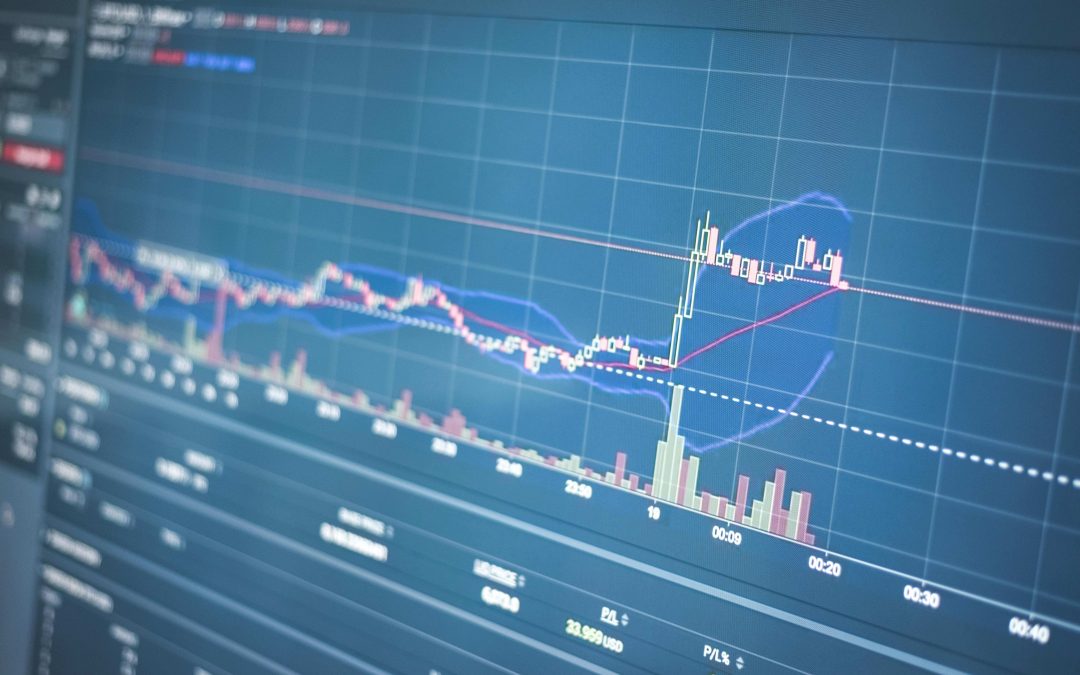
If you’ve been stalking Bitcoin’s price action, you’ve seen volatility dry up while traders pace in circles, sweating over potential FOMO and liquidation risk. The Bitcoin Bollinger Bands are screaming an imminent move—possibly the most decisive breakout we’ve witnessed in years. As the Bitcoin Bollinger Bands reach record tightness, experienced speculators know this compression means that the powder keg of volatility is about to ignite. Positioning now carries outsized opportunity—but also the threat of rapid liquidation or missed alpha, as the market’s next direction could be explosive.
Across crypto Twitter, top analysts are highlighting the rare squeeze on Bitcoin Bollinger Bands, signaling the start of a powerful trend. Key resistance and whale order books reveal a battleground in the $78,000–$80,000 zone, while historical analogs and technical signals suggest the stage is set for BTC to either rip higher or cascade lower at breakneck speed. Is your trading plan ready? Dive deep into the critical technicals, price levels, and risk factors that will filter winners from bag holders.
Why Bitcoin Bollinger Bands Are Sounding the Alarm
The Bitcoin Bollinger Bands indicator, a staple tool for veteran traders, measures volatility relative to price. When these bands contract to historic tightness—like they have now on the monthly chart—it almost always foreshadows a dramatic increase in volatility and price movement. The current band squeeze is the tightest ever recorded, according to recent TradingView data and commentary from Cantonese Cat, a respected market analyst.
The significance? Every notable Bitcoin bull run in the last decade was preceded by a similar squeeze in the Bitcoin Bollinger Bands. In late 2015, 2016, and again in late 2020, bands compressed before explosive rallies—4200% in 2016–2017, 520% in 2020–2021. Traders with options strategies, leverage positions, and swing trades know the best risk-reward setups happen in these moments of extreme compression.
Understanding the Technical Landscape: RSI, MACD, and Historical Signals
Beyond the Bitcoin Bollinger Bands, several other technical indicators are converging to tip off smart traders. The monthly Relative Strength Index (RSI) is at lows not seen since late 2022, coinciding with Bitcoin’s drop to a multi-year support trendline. Historically, oversold RSI paired with price at key trend support has marked macro bottoms, setting up massive accumulation moves and breakouts.
The weekly MACD just triggered a bullish crossover—a statistically potent signal for momentum traders. Past instances of MACD crossovers during tight Bollinger periods have led to multi-month rally phases, drawing institutional flows and revitalizing risk-on sentiment.
Price Action: The $80K Resistance and What Lies Above
As of today, Bitcoin is trading around $78,000 USD, clawing back after a 6% rally over three days. The CME gap between $74,000–$77,000 was filled, aligning with classic mean-reversion mechanics observed around major exchanges. However, the next CME gap at $80,000 is a magnet for both bulls and bears—marking a zone of intense order flow, whale battles, and critical resistance.
Order book analysis from CoinGlass reveals heavy sell pressure between $78,000–$80,000, mostly from large holders and institutional accounts. Market commentator Michael van de Poppe notes that the $79,000 wall could temporarily stall upward momentum, but a confirmed breakout with strong buyers could propel BTC toward $86,000, then potentially $126,000—the new all-time high cited in recent analyst forecasts.
Tokenomics, Market Cap & Liquidity: Where the Money Moves
Bitcoin’s tokenomics remain unchanged: 21 million fixed supply, with major exchanges and OTC desks reporting demand spikes whenever volatility returns. Current market cap sits above $1.5 trillion, with daily volumes rebounding toward $38 billion USD as traders pile in ahead of the expected move. Liquidity has tightened, evidenced by lower bid-ask depth on major brokers, meaning slippage risk is elevated—particularly for leveraged players.
Institutional buying was strong throughout the week, with whale addresses accumulating in the $74K–$76K range. Historically, these entities drive the first legs of bull runs before retail sentiment catches fire. Exchange flows show reduced inflows to Binance and Coinbase, suggesting coins are migrating to cold storage—a classic precursor to speculative blow-off tops.
Technical Trading Blueprint: Levels, Triggers, and Steps
Key Steps for Profiting from a Bollinger Band Squeeze
- Identify the squeeze: On TradingView, set monthly candles. Confirm historically tight Bitcoin Bollinger Bands.
- Pinpoint resistance: Watch $78K–$80K zones for seller concentration and whale walls.
- MACD and RSI validation: Only trade breakout moves if weekly MACD is bullish and RSI is rebounding off support.
- Trigger orders: Enter with scale orders above $80K. Stop losses beneath $76K and $73K support.
- Ride momentum: On breakout, look for volume surge. The real alpha happens in first leg momentum.
- Manage risk dynamically: Adjust stops as price clears $86K, targeting potential $84K–$126K as next zones.
Sentiment and Speculator Behavior: FOMO or Fear?
Crypto Twitter is ablaze. Traders expect Bitcoin Bollinger Bands to deliver “the most powerful move this cycle,” but anxiety is equally intense. The fear of missing out is real, driving speculative buy orders, but equally, liquidation risk hangs over the heads of leveraged traders. News flow is positive: ETF inflows are rising, macro conditions favor risk assets, and the dollar index (DXY) is softening.
Most seasoned traders are advised to wait for a confirmed breakout—never chase false moves within range-bound action. If BTC closes above $78K–$80K with volume, expect momentum traders to pile in, pushing price toward $84K–$126K. Below $73K, be wary: a sweep could trigger cascading liquidations and reset risk entirely.
Whale Order Books and Market Structure: The Alpha Zone
The Bitcoin whale order books are dense between $78,000–$80,000. Large clusters of sell orders indicate both resistance and a possible liquidity pool for stop hunts. If bulls absorb these, spot traders and derivatives players could quickly force shorts to cover, driving a forced move as liquidity vacates. Conversely, a rejection will prompt bears to reload positions, possibly sending BTC back toward its multi-year support at $73,800.
Smart money follows volume and intent. The alpha lies in waiting for whales to blink—watch for market structure shifts, high-volume surges, and the inevitable race toward the next gap above $84K. Don’t be caught overexposed if whales flip script.
Risk Management: Protecting the Alpha
With Bitcoin Bollinger Bands signaling unprecedented volatility, risk management becomes the defining skill for all traders. Use layered stop-losses, adjust leverage to volatile environments, and embrace probability rather than hope. Consider options strategies to hedge directional bias—straddles, strangles, and volatility plays grow in utility as bands tighten and price launches. If long, trail stops beneath confirmed support; if short, trail stops above resistance walls.
Be agile. Set alerts for all critical price levels, and never risk capital you cannot afford to lose. Remember: the market does not reward greed or complacency in these moments—only precision, discipline, and the ability to adapt.